Verified review
Maria Ribeiro
Full-Body Empower Experience
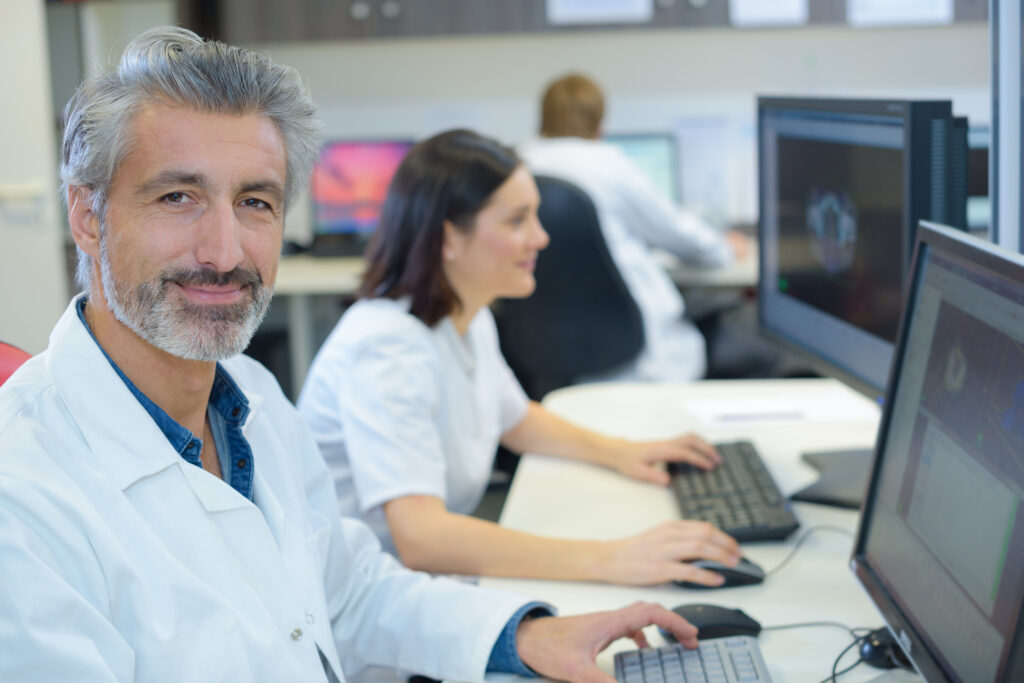
Diagnostics
A structured overview of systemic bioinformational findings — stress parameters, CSS values, and multi-system patterns from your remote scan.
Stress Parameters: Coefficients of Spectral Similarity (CSS) Values
The analysis compares measured biological signals with thousands of reference patterns stored in the system’s frequency library. Instead of diagnosing conditions directly, the software highlights areas where the body’s signals appear under stress or functioning outside their usual balance.
These findings help organize complex biological information into recognizable patterns. The goal is clarity — large volumes of biological data presented in a structured, readable format so practitioners and users can see which areas may deserve monitoring, support, or further professional evaluation.
Download sample PDF report →
The Nonlinear Systems Body Analysis compares measured bioresonance signals with reference frequency patterns known as etalons. These comparisons generate Coefficients of Spectral Similarity (CSS), indicating how closely a detected signal corresponds to specific biological structures, microorganisms, biochemical markers, allergens, or functional states.
By analyzing these spectral relationships, the system can highlight areas where biological signals deviate from their optimal reference patterns. CSS values serve as analytical indicators that help organize and interpret the large library of biological reference patterns.
Stress disrupts the body’s natural balance, increasing internal disorder (entropy). This accelerates the risk of disease and the gradual decline of vital systems. By measuring and managing stress, we help restore harmony, supporting resilience, vitality, and long-term well-being.
Sample Report — For Reference Only
Each category uses Coefficients of Spectral Similarity (CSS) to indicate stress relative to reference etalons. Thresholds vary by group — see the examples below.
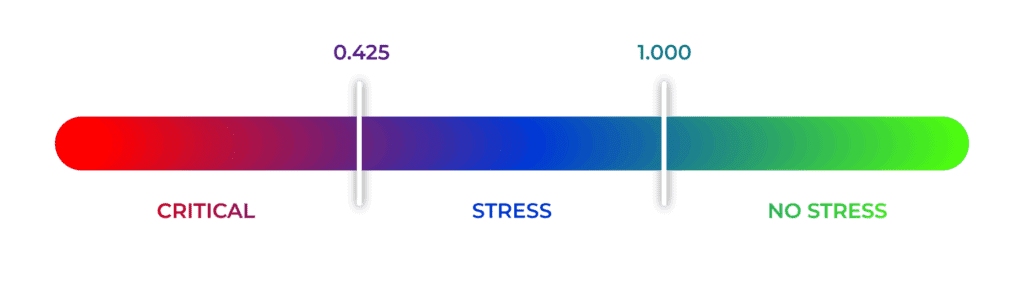
Pathologies with values above 1.000 are not stressful, but those below this threshold cause stress. Pathologies with values below 0.425 are critical.
Microorganisms and helminths with values above 1.000 are not stressful, but those with lower values are, with those below 0.425 being critical.
Meridian findings follow the same thresholds: values above 1.000 are not stressful, values below 1.000 cause stress, and values below 0.425 are critical. These signals are often subtle stressors and may not appear in every report.
Allergens with values above 1.000 do not cause stress, while those below 1.000 do cause stress. Allergens with values below 0.425 are considered critical.
Red zones (below 0.425) indicate areas of concern that need immediate attention. The blue zone (below 1.000) indicates stressors that could become problematic if not addressed, while the green zone (above 1.000) indicates areas unlikely to contribute to stress in the short-term future.
Different threshold chart
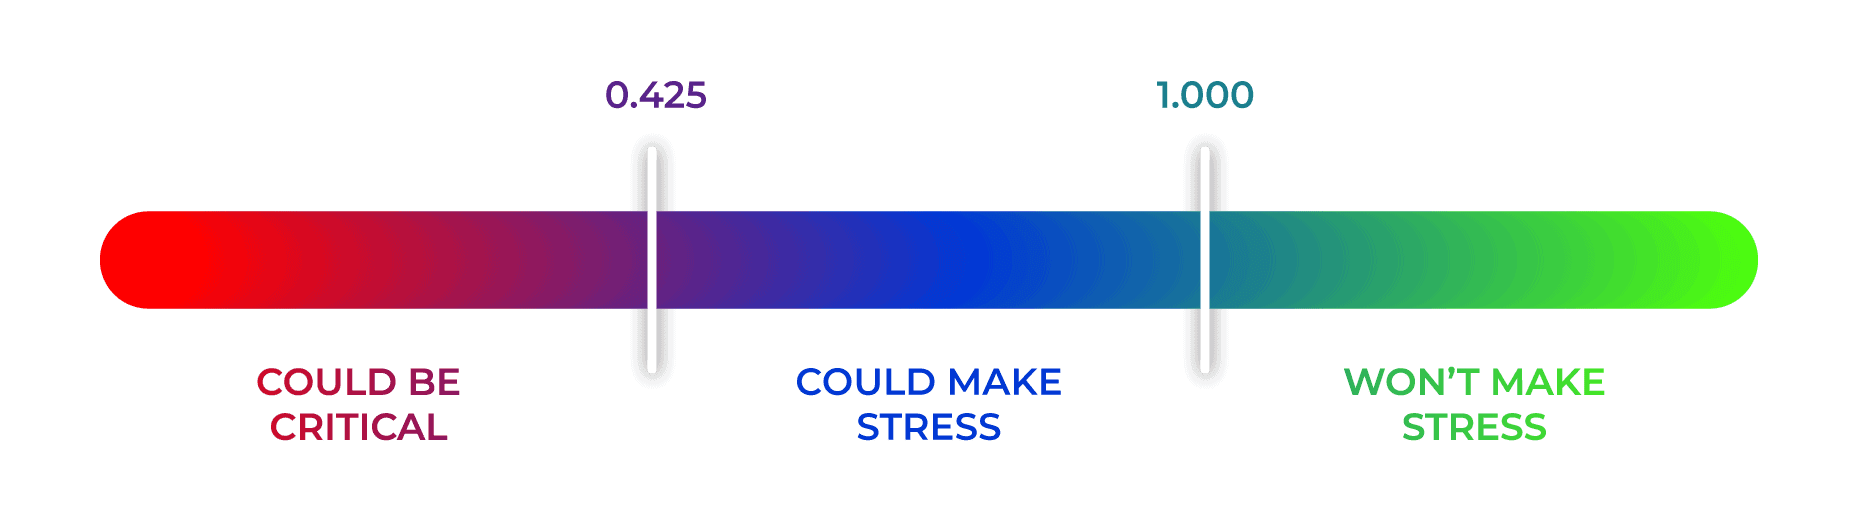
Genetic factors with values above 1.000 do not cause stress. However, those below 1.000 are already active and cause stress, with values below 0.425 being critical.
Different threshold chart
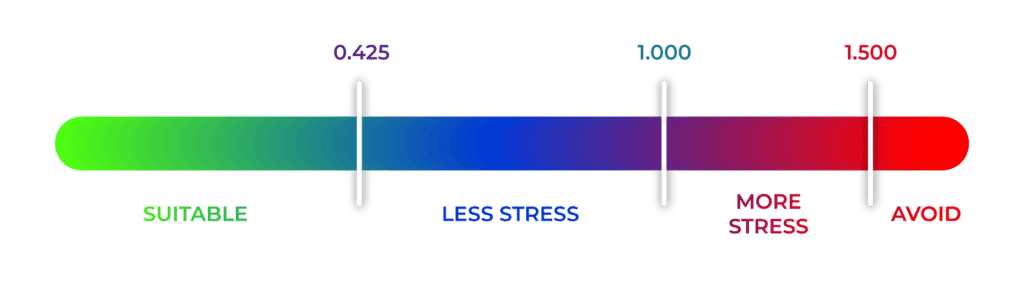
Food items with values above 1.500 cause significant stress. Those with values below 1.000 cause less stress, and items below 0.425 cause the least stress.
Your report, explained
After your remote scan, your NLS Body Analysis Report brings together pathologies, microbes, meridians, allergens, and physiotherapy markers in one structured view — so you and your practitioner can discuss priorities clearly.
This non-invasive method offers a holistic overview of your physical and energetic well-being.
Create your Quantum Meta Health account and unlock access to advanced body analysis tools designed to put your health insights in your own hands.
Upload a headshot, full-body photo, and a few details like birthdate and blood type so the system can generate your personalized scan.
Choose a convenient time for your session — our technology will analyze your data and transmit healing frequencies that support well-being for weeks.
Upload your photos, book a remote scan, and receive your personalized NLS Body Analysis Report.